
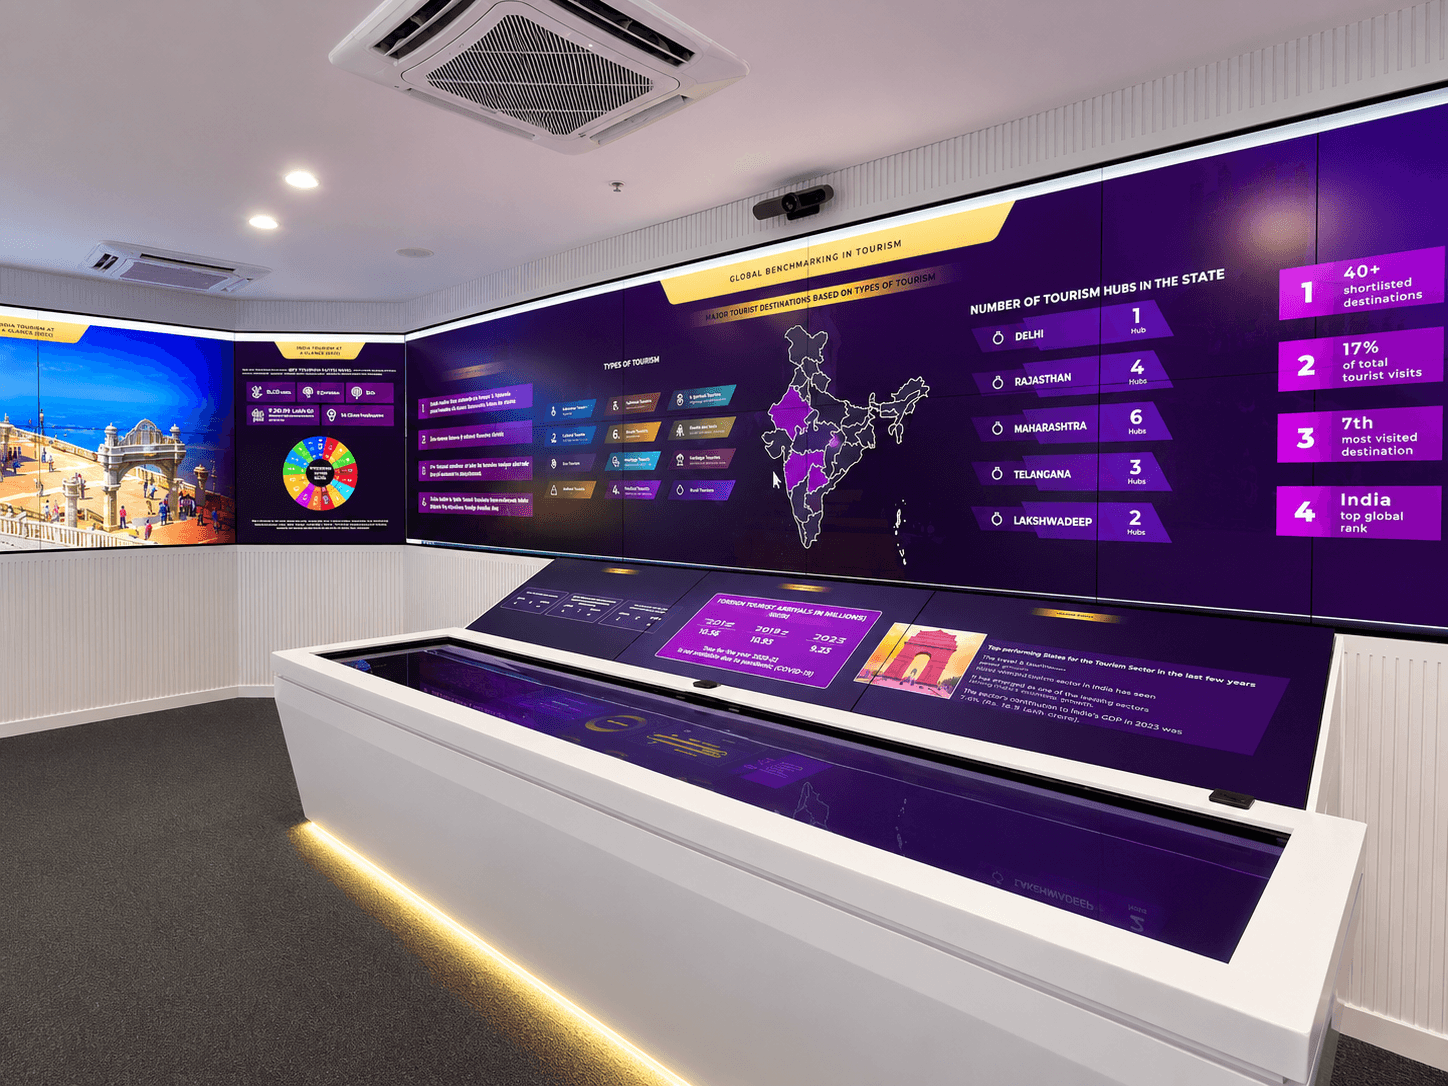
Niti Aayog (Experience Center)
“India is leveraging digital infrastructure, frontier technologies, and data-driven decision making to drive progress.”
“India is leveraging digital infrastructure, frontier technologies, and data-driven decision making to drive progress.”
“India is leveraging digital infrastructure, frontier technologies, and data-driven decision making to drive progress.”
— Bill Gates
— Bill Gates
— Bill Gates
Niti Aayog (Experience Center)
Niti Aayog (Experience Center)
Niti Aayog (Experience Center)
Project Overview
Project Overview
Immersive Platform
Immersive Platform
Immersive policy visualization and decision support platform.
Immersive policy visualization and decision support platform.
Actionable Insights
Actionable Insights
Transformed complex governance data into actionable insights.
Transformed complex governance data into actionable insights.
Real-Time Monitoring
Real-Time Monitoring
Enabled real-time monitoring, policy reviews, and strategic planning.
Enabled real-time monitoring, policy reviews, and strategic planning.
Built for Decision-Makers
Built for Decision-Makers
Designed for ministers, bureaucrats district officials,
and policymakers.
Designed for ministers, bureaucrats district officials, and policymakers.
Project Overview
Immersive Platform
Immersive policy visualization and decision support platform.
Actionable Insights
Transformed complex governance data into actionable insights.
Real-Time Monitoring
Enabled real-time monitoring, policy reviews, and strategic planning.
Built for Decision-Makers
Designed for ministers, bureaucrats district officials,
and policymakers.
About NITI Aayog
About NITI Aayog
Established in 2015 as the Government of India’s premier policy think tank replacing the Planning Commission with a more collaborative, technology driven, and data-oriented framework for governance.
Established in 2015 as the Government of India’s premier policy think tank replacing the Planning Commission with a more collaborative, technology driven, and data-oriented framework for governance.
Focus Areas
Focus Areas
01
01
Governance & Reforms
Governance & Reforms
02
02
Data Management & Analytics
Data Management & Analytics
03
03
Sustainable Development Goals
Sustainable Development Goals
04
04
Education & Health
Education & Health
05
05
Agriculture & Rural Development
Agriculture & Rural Development
06
06
Infrastructure & Connectivity
Infrastructure & Connectivity
07
07
Innovation & Entrepreneurship
Innovation & Entrepreneurship
08
08
Monitoring & Evaluation
Monitoring & Evaluation
Project Vision & Objectives
Project Vision & Objectives
Project Vision & Objectives
Vision
Vision
Vision
Key Objectives
Key Objectives
Key Objectives
Data-Driven Governance
Data-Driven Governance
Data-Driven Governance
Visualize large-scale governance data
Monitor district and state performance in real time
Analyze trends and identify development gaps
Visualize large-scale governance data
Monitor district and state performance in real time
Analyze trends and identify development gaps
Visualize large-scale governance data
Monitor district and state performance in real time
Analyze trends and identify development gaps
Decision Support
Decision Support
Decision Support
Enable evidence-based decision-making
Support strategic policy reviews
Facilitate collaborative discussions among stakeholders
Enable evidence-based decision-making
Support strategic policy reviews
Facilitate collaborative discussions among stakeholders
Enable evidence-based decision-making
Support strategic policy reviews
Facilitate collaborative discussions among stakeholders
Immersive Experience
Immersive Experience
Immersive Experience
Deliver interactive dashboards and data storytelling
Create engaging presentation experiences for government delegates
Simplify complex information without overwhelming users
Deliver interactive dashboards and data storytelling
Create engaging presentation experiences for government delegates
Simplify complex information without overwhelming users
Deliver interactive dashboards and data storytelling
Create engaging presentation experiences for government delegates
Simplify complex information without overwhelming users
Connected Ecosystem
Connected Ecosystem
Connected Ecosystem
Integrate data from multiple governance sources
Provide seamless presentation and control systems
Support real-time monitoring and analytical workflows
Integrate data from multiple governance sources
Provide seamless presentation and control systems
Support real-time monitoring and analytical workflows
Integrate data from multiple governance sources
Provide seamless presentation and control systems
Support real-time monitoring and analytical workflows
Design an immersive, data-driven governance platform that transforms complex national datasets into actionable insights, enabling policymakers
to make faster, more informed, and collaborative decisions.
Design an immersive, data-driven governance platform that transforms complex national datasets into actionable insights, enabling policymakers
to make faster, more informed, and collaborative decisions.
Design an immersive, data-driven governance platform that transforms complex national datasets into actionable insights, enabling policymakers
to make faster, more informed, and collaborative decisions.
Problem Statement
Problem Statement
Problem Statement
01
01
01
Information Overload
Information Overload
Information Overload
Large volumes of data made it difficult for stakeholders to quickly identify critical insights and trends.
Large volumes of data made it difficult for stakeholders to quickly identify critical insights and trends.
Large volumes of data made it difficult for stakeholders to quickly identify critical insights and trends.
02
02
02
Fragmented Data Ecosystem
Fragmented Data Ecosystem
Fragmented Data Ecosystem
Information was distributed across multiple systems, limiting unified analysis and cross-department collaboration.
Information was distributed across multiple systems, limiting unified analysis and cross-department collaboration.
Information was distributed across multiple systems, limiting unified analysis and cross-department collaboration.
03
03
03
Static Reporting Experience
Static Reporting Experience
Static Reporting Experience
Traditional reports and dashboards lacked interactivity, making exploration and decision-making slow and inefficient.
Traditional reports and dashboards lacked interactivity, making exploration and decision-making slow and inefficient.
Traditional reports and dashboards lacked interactivity, making exploration and
decision-making slow and inefficient.
04
04
04
Limited Performance Visibility
Limited Performance Visibility
Limited Performance Visibility
Comparing district and state-level performance metrics required significant manual effort and interpretation.
Comparing district and state-level performance metrics required significant manual effort and interpretation.
Comparing district and state-level performance metrics required significant manual effort and interpretation.
05
05
05
Low Engagement in Review Meetings
Low Engagement in Review Meetings
Low Engagement in Review Meetings
Conventional presentation formats reduced collaboration, engagement, and real-time strategic discussions.
Conventional presentation formats reduced collaboration, engagement, and real-time strategic discussions.
Conventional presentation formats reduced collaboration, engagement, and real-time strategic discussions.
Target Stakeholders
#
Stakeholder
Purpose
01
PM & Cabinet Secretaries
Strategic national-level reviews
02
Chief Ministers & Chief Secretaries
State performance monitoring
03
District Magistrates & Officials
District and block-level analysis
04
Policy Analysts
Trend analysis and comparative studies
05
Delegates & International Visitors
Demonstration of India’s digital governance initiatives
Target Stakeholders
#
Stakeholder
Purpose
01
PM & Cabinet Secretaries
Strategic national-level reviews
02
Chief Ministers & Chief Secretaries
State performance monitoring
03
District Magistrates & Officials
District and block-level analysis
04
Policy Analysts
Trend analysis and comparative studies
05
Delegates & International Visitors
Demonstration of India’s digital governance initiatives
Target Stakeholders
#
Stakeholder
Purpose
01
PM & Cabinet Secretaries
Strategic national-level reviews
02
Chief Ministers & Chief Secretaries
State performance monitoring
03
District Magistrates & Officials
District and block-level analysis
04
Policy Analysts
Trend analysis and comparative studies
05
Delegates & International Visitors
Demonstration of India’s digital governance initiatives
UX Challenges
UX Challenges
UX Challenges
01
01
01
Designing for Multiple User Types
Designing for Multiple User Types
Designing for Multiple User Types
Citizens, analysts, and policymakers all rely on the same dashboards each expecting a completely different depth of detail.
Citizens, analysts, and policymakers all rely on the same dashboards each expecting a completely different depth of detail.
Citizens, analysts, and policymakers all rely on the same dashboards each expecting a completely different depth of detail.
02
02
02
Managing High Information Density
Managing High Information Density
Managing High Information Density
Government datasets are large, complex, and layered balancing information depth, visual simplicity, real-time readability, and executive-level clarity.
Government datasets are large, complex, and layered balancing information depth, visual simplicity, real-time readability, and executive-level clarity.
Government datasets are large, complex, and layered balancing information depth, visual simplicity, real-time readability, and executive-level clarity.
04
04
04
Fast-Paced Decision-Making Environment
Fast-Paced Decision-Making Environment
Fast-Paced Decision-Making Environment
Reducing interaction time while maintaining information accuracy inside high-pressure decision rooms.
Reducing interaction time while maintaining information accuracy inside high-pressure decision rooms.
Reducing interaction time while maintaining information accuracy inside high-pressure decision rooms.
03
03
03
Designing for Large-Scale Immersive Screens
Designing for Large-Scale Immersive Screens
Designing for Large-Scale Immersive Screens
Building a scalable information hierarchy that stays clear and legible across large viewing distances.
Building a scalable information hierarchy that stays clear and legible across large viewing distances.
Building a scalable information hierarchy that stays clear and legible across large viewing distances.
THE APPROACH
THE APPROACH
THE APPROACH
Solution
Solution
Solution
Transforming Governance Data Into an Immersive Decision-Making Experience
Transforming Governance Data Into an Immersive Decision-Making Experience
Transforming Governance Data Into an Immersive Decision-Making Experience
DESIGN PROCESS
DESIGN PROCESS
DESIGN PROCESS
How the experience came together, step by step
How the experience came together, step by step
How the experience came together, step by step
01
01
01
Understanding the Core Problem
Understanding the Core Problem
Understanding the Core Problem
02
02
02
AI-Powered Data Digitization System
AI-Powered Data Digitization System
AI-Powered Data Digitization System
03
03
03
Ideation & Experience Visualization
Ideation & Experience Visualization
Ideation & Experience Visualization
04
04
04
Spatial Experience Planning & Screen Mapping
Spatial Experience Planning & Screen Mapping
Spatial Experience Planning & Screen Mapping
05
05
05
Information Architecture
Information Architecture
Information Architecture
06
06
06
Final UI Design System & Experience Centre Visualization
Final UI Design System & Experience Centre Visualization
Final UI Design System & Experience Centre Visualization
01 — Understanding the Core Problem
01 — Understanding the Core Problem
01 — Understanding the Core Problem
The Data Fragmentation Challenge
The Data Fragmentation Challenge
The Data Fragmentation Challenge
Data
Landscape
Data
Landscape
Data
Landscape
This created major barriers in:
This created major barriers in:
This created major barriers in:
Data
Accessibility
Data
Accessibility
Data
Accessibility
Real-time Analysis
Real-time Analysis
Real-time Analysis
Cross-department
Collaboration
Cross-department
Collaboration
Cross-department
Collaboration
Visualization
and Reporting
Visualization
and Reporting
Visualization
and Reporting
Strategic
Decision-making
Strategic
Decision-making
Strategic
Decision-making
70% of government data in physical formats
70% of government data in physical formats
70% of government data in physical formats
70%
70%
70%
Printed Reports
Printed Reports
Printed Reports
Handwritten Documents
Handwritten Documents
Handwritten Documents
Offline Departmental records
Offline Departmental records
Offline Departmental records
30% of government data in digital formats
30% of government data in digital formats
30% of government data in digital formats
30%
30%
30%
Excel Sheets
Excel Sheets
Excel Sheets
Dashboards
Dashboards
Dashboards
Existing Database
Existing Database
Existing Database
06 — Final UI Design System & Experience Centre Visualization
06 — Final UI Design System & Experience Centre Visualization
06 — Final UI Design System & Experience Centre Visualization
After defining the information architecture and screen ecosystem, the final phase focused on designing the visual identity and immersive environment of the NITI Aayog Experience Centre.
After defining the information architecture and screen ecosystem, the final phase focused on designing the visual identity and immersive environment of the NITI Aayog Experience Centre.
After defining the information architecture and screen ecosystem, the final phase focused on designing the visual identity and immersive environment of the NITI Aayog Experience Centre.

Urban sector selected
Urban sector selected
Urban sector selected
S1
S1
S1
S1
S1
S1
S1
S1
S1
S1
S1
S1
S2
S2
S2
S2
S2
S2
S2
S2
S2
S2
S2
S2
S3
S3
S3
S3
S3
S3
S3
S3
S3
S3
S3
S3
S4
S4
S4
S4
S4
S4
S4
S4
S4
S4
S4
S4
Connecting screen
Connecting screen
Connecting screen
Connecting screen
Connecting screen
Connecting screen
Connecting screen
Connecting screen
Connecting screen
Connecting screen
Connecting screen
Connecting screen
Control panel
Control panel
Control panel
Control panel
Control panel
Control panel
Control panel
Control panel
Control panel
Control panel
Control panel
Control panel
S5
S5
S5
S5
S5
S5
S5
S5
S5
S5
S5
S5

F.A.1-"Gender sensitivity across the Urban sector" selected
F.A.1-"Gender sensitivity across the Urban sector" selected
F.A.1-"Gender sensitivity across the Urban sector" selected

F.A.2-"Promoting affordable housing in India's urban areas" selected
F.A.2-"Promoting affordable housing in India's urban areas" selected
F.A.2-"Promoting affordable housing in India's urban areas" selected

F.A.3-"Strengthening Municipal Finance Systems of cities" selected
F.A.3-"Strengthening Municipal Finance Systems of cities" selected
F.A.3-"Strengthening Municipal Finance Systems of cities" selected
On Site Footage and News Clips
On Site Footage and News Clips


On Site Footage and News Clips
Impact.
Impact.
Transforming Governance Data Into Actionable Intelligence
The NITI Aayog Experience Centre was envisioned as more than a visualization space — it became a strategic governance ecosystem designed to improve how policymakers interact with national development data.
By integrating AI-powered digitization, immersive visualization, and collaborative spatial experiences, the project helped bridge the gap between fragmented information and informed decision-making.
Transforming Governance Data Into Actionable Intelligence
The NITI Aayog Experience Centre was envisioned as more than a visualization space — it became a strategic governance ecosystem designed to improve how policymakers interact with national development data.
By integrating AI-powered digitization, immersive visualization, and collaborative spatial experiences, the project helped bridge the gap between fragmented information and informed decision-making.
Faster Decisions
Faster Decisions
Real-time access to national development data for policymakers.
Real-time access to national development data for policymakers.
AI Digitization
AI Digitization
Automated processing of fragmented governance records.
Automated processing of fragmented governance records.
Immersive Insight
Immersive Insight
Spatial, 3D visualization that makes complex policy data clear.
Spatial, 3D visualization that makes complex policy data clear.
Unified Access
Unified Access
One collaborative ecosystem connecting people and information.
One collaborative ecosystem connecting people and information.
Impact.
Transforming Governance Data Into Actionable Intelligence
The NITI Aayog Experience Centre was envisioned as more than a visualization space — it became a strategic governance ecosystem designed to improve how policymakers interact with national development data.
By integrating AI-powered digitization, immersive visualization, and collaborative spatial experiences, the project helped bridge the gap between fragmented information and informed decision-making.
Faster Decisions
Real-time access to national development data for policymakers.
AI Digitization
Automated processing of fragmented governance records.
Immersive Insight
Spatial, 3D visualization that makes complex policy data clear.
Unified Access
One collaborative ecosystem connecting people and information.
02 — AI-Powered Data Digitization System
02 — AI-Powered Data Digitization System
02 — AI-Powered Data Digitization System
Converting Physical Governance Data Into Structured Digital Intelligence
Converting Physical Governance Data Into Structured Digital Intelligence
Converting Physical Governance Data Into Structured Digital Intelligence
Ai System Workflow
Ai System Workflow
Ai System Workflow
This process helped transform scattered governance information into a centralized digital ecosystem
This process helped transform scattered governance information into a centralized digital ecosystem
This process helped transform scattered governance information into a centralized digital ecosystem
01
01
01
Scan
Scan
Scan
Scan physical
government
documents
Scan physical
government
documents
Scan physical
government
documents
02
02
02
Extract
Extract
Extract
Extract
structured
information
Extract
structured
information
Extract
structured
information
03
03
03
Recognize
Recognize
Recognize
Recognize
tables and
text
Recognize
tables and
text
Recognize
tables and
text
04
04
04
Convert
Convert
Convert
Convert
records into
editable digital
formats
Convert
records into
editable digital
formats
Convert
records into
editable digital
formats
05
05
05
Organize
Organize
Organize
Organize data
for analytics
and visualization
Organize data
for analytics
and visualization
Organize data
for analytics
and visualization
03 — Ideation & Experience Visualization
03 — Ideation & Experience Visualization
03 — Ideation & Experience Visualization
With a fully digital ecosystem in place, the next challenge was determining how this information should be
presented inside the Experience Centre.
With a fully digital ecosystem in place, the next challenge was determining how this information should be
presented inside the Experience Centre.
With a fully digital ecosystem in place, the next challenge was determining how this information should be
presented inside the Experience Centre.
Large Numeric
Indicators
Large Numeric
Indicators
Large Numeric
Indicators
Used for:
Used for:
Used for:
• District rankings
• Growth metrics
• Performance indicators
• District rankings
• Growth metrics
• Performance indicators
• District rankings
• Growth metrics
• Performance indicators
Number of cities in which metro rail lines under construction
Number of cities in which metro rail lines under construction
Number of cities in which metro rail lines under construction

27km
27km
27km
Length of metro rail lines under construction
Length of metro rail lines under construction
Length of metro rail lines under construction
791km
791km
791km
Graphical
Visualization
Graphical
Visualization
Graphical
Visualization
Used for:
Used for:
Used for:
Households living in non-serviceable kutcha (makeshift houses)
Households living in non-serviceable kutcha (makeshift houses)
Households living in non-serviceable kutcha (makeshift houses)
No. of housing units (in million)
No. of housing units (in million)
No. of housing units (in million)
Households living in obsolescent houses
Households living in obsolescent houses
Households living in obsolescent houses
Households living in congested houses
Households living in congested houses
Households living in congested houses
Housing Demand Category
Housing Demand Category
Housing Demand Category
Households in homeless condition
Households in homeless condition
Households in homeless condition
100
100
100
90
90
90
80
80
80
70
70
70
60
60
60
50
50
50
40
40
40
30
30
30
20
20
20
10
10
10
0
0
0
No. of Housing units (%)
No. of Housing units (%)
No. of Housing units (%)
No. of housing units (in million)
No. of housing units (in million)
No. of housing units (in million)
• Trend analysis
• Development tracking
• Progress monitoring
• Trend analysis
• Development tracking
• Progress monitoring
• Trend analysis
• Development tracking
• Progress monitoring
Used for:
Used for:
Used for:
Pie Charts and
Statical Systems
Pie Charts and
Statical Systems
Pie Charts and
Statical Systems
Owned
63.9%
Owned
63.9%
Owned
63.9%
Hired
32.8%
Hired
32.8%
Hired
32.8%
Others
3.3%
Others
3.3%
Others
3.3%
Source: Handbook of Urban Statistics, 2022
Source: Handbook of Urban Statistics, 2022
• Percentange distribution
• Resource allocation
• Category analysis
• Percentange distribution
• Resource allocation
• Category analysis
• Percentange distribution
• Resource allocation
• Category analysis
Used for:
Used for:
Used for:
Image and media
Integration
Image and media
Integration
Image and media
Integration
• Regional representation
• Presentation engagement
• Regional representation
• Presentation engagement
• Regional representation
• Presentation engagement

The small town primarily relies on small three-wheeler autos and tempos to meet their transportation needs and this was a government initiative to make the services more inclusive. Female drivers were hired to drive the vehicles which were coloured differently to allow for easy identification. Support infrastructure provided by the local government included CCTV cameras, signages and police watch towers to ensure safety.
The small town primarily relies on small three-wheeler autos and tempos to meet their transportation needs and this was a government initiative to make the services more inclusive. Female drivers were hired to drive the vehicles which were coloured differently to allow for easy identification. Support infrastructure provided by the local government included CCTV cameras, signages and police watch towers to ensure safety.
The small town primarily relies on small three-wheeler autos and tempos to meet their transportation needs and this was a government initiative to make the services more inclusive. Female drivers were hired to drive the vehicles which were coloured differently to allow for easy identification. Support infrastructure provided by the local government included CCTV cameras, signages and police watch towers to ensure safety.
Improving Housing Conditions
under PMAY
Improving Housing Conditions
under PMAY
Improving Housing Conditions
under PMAY
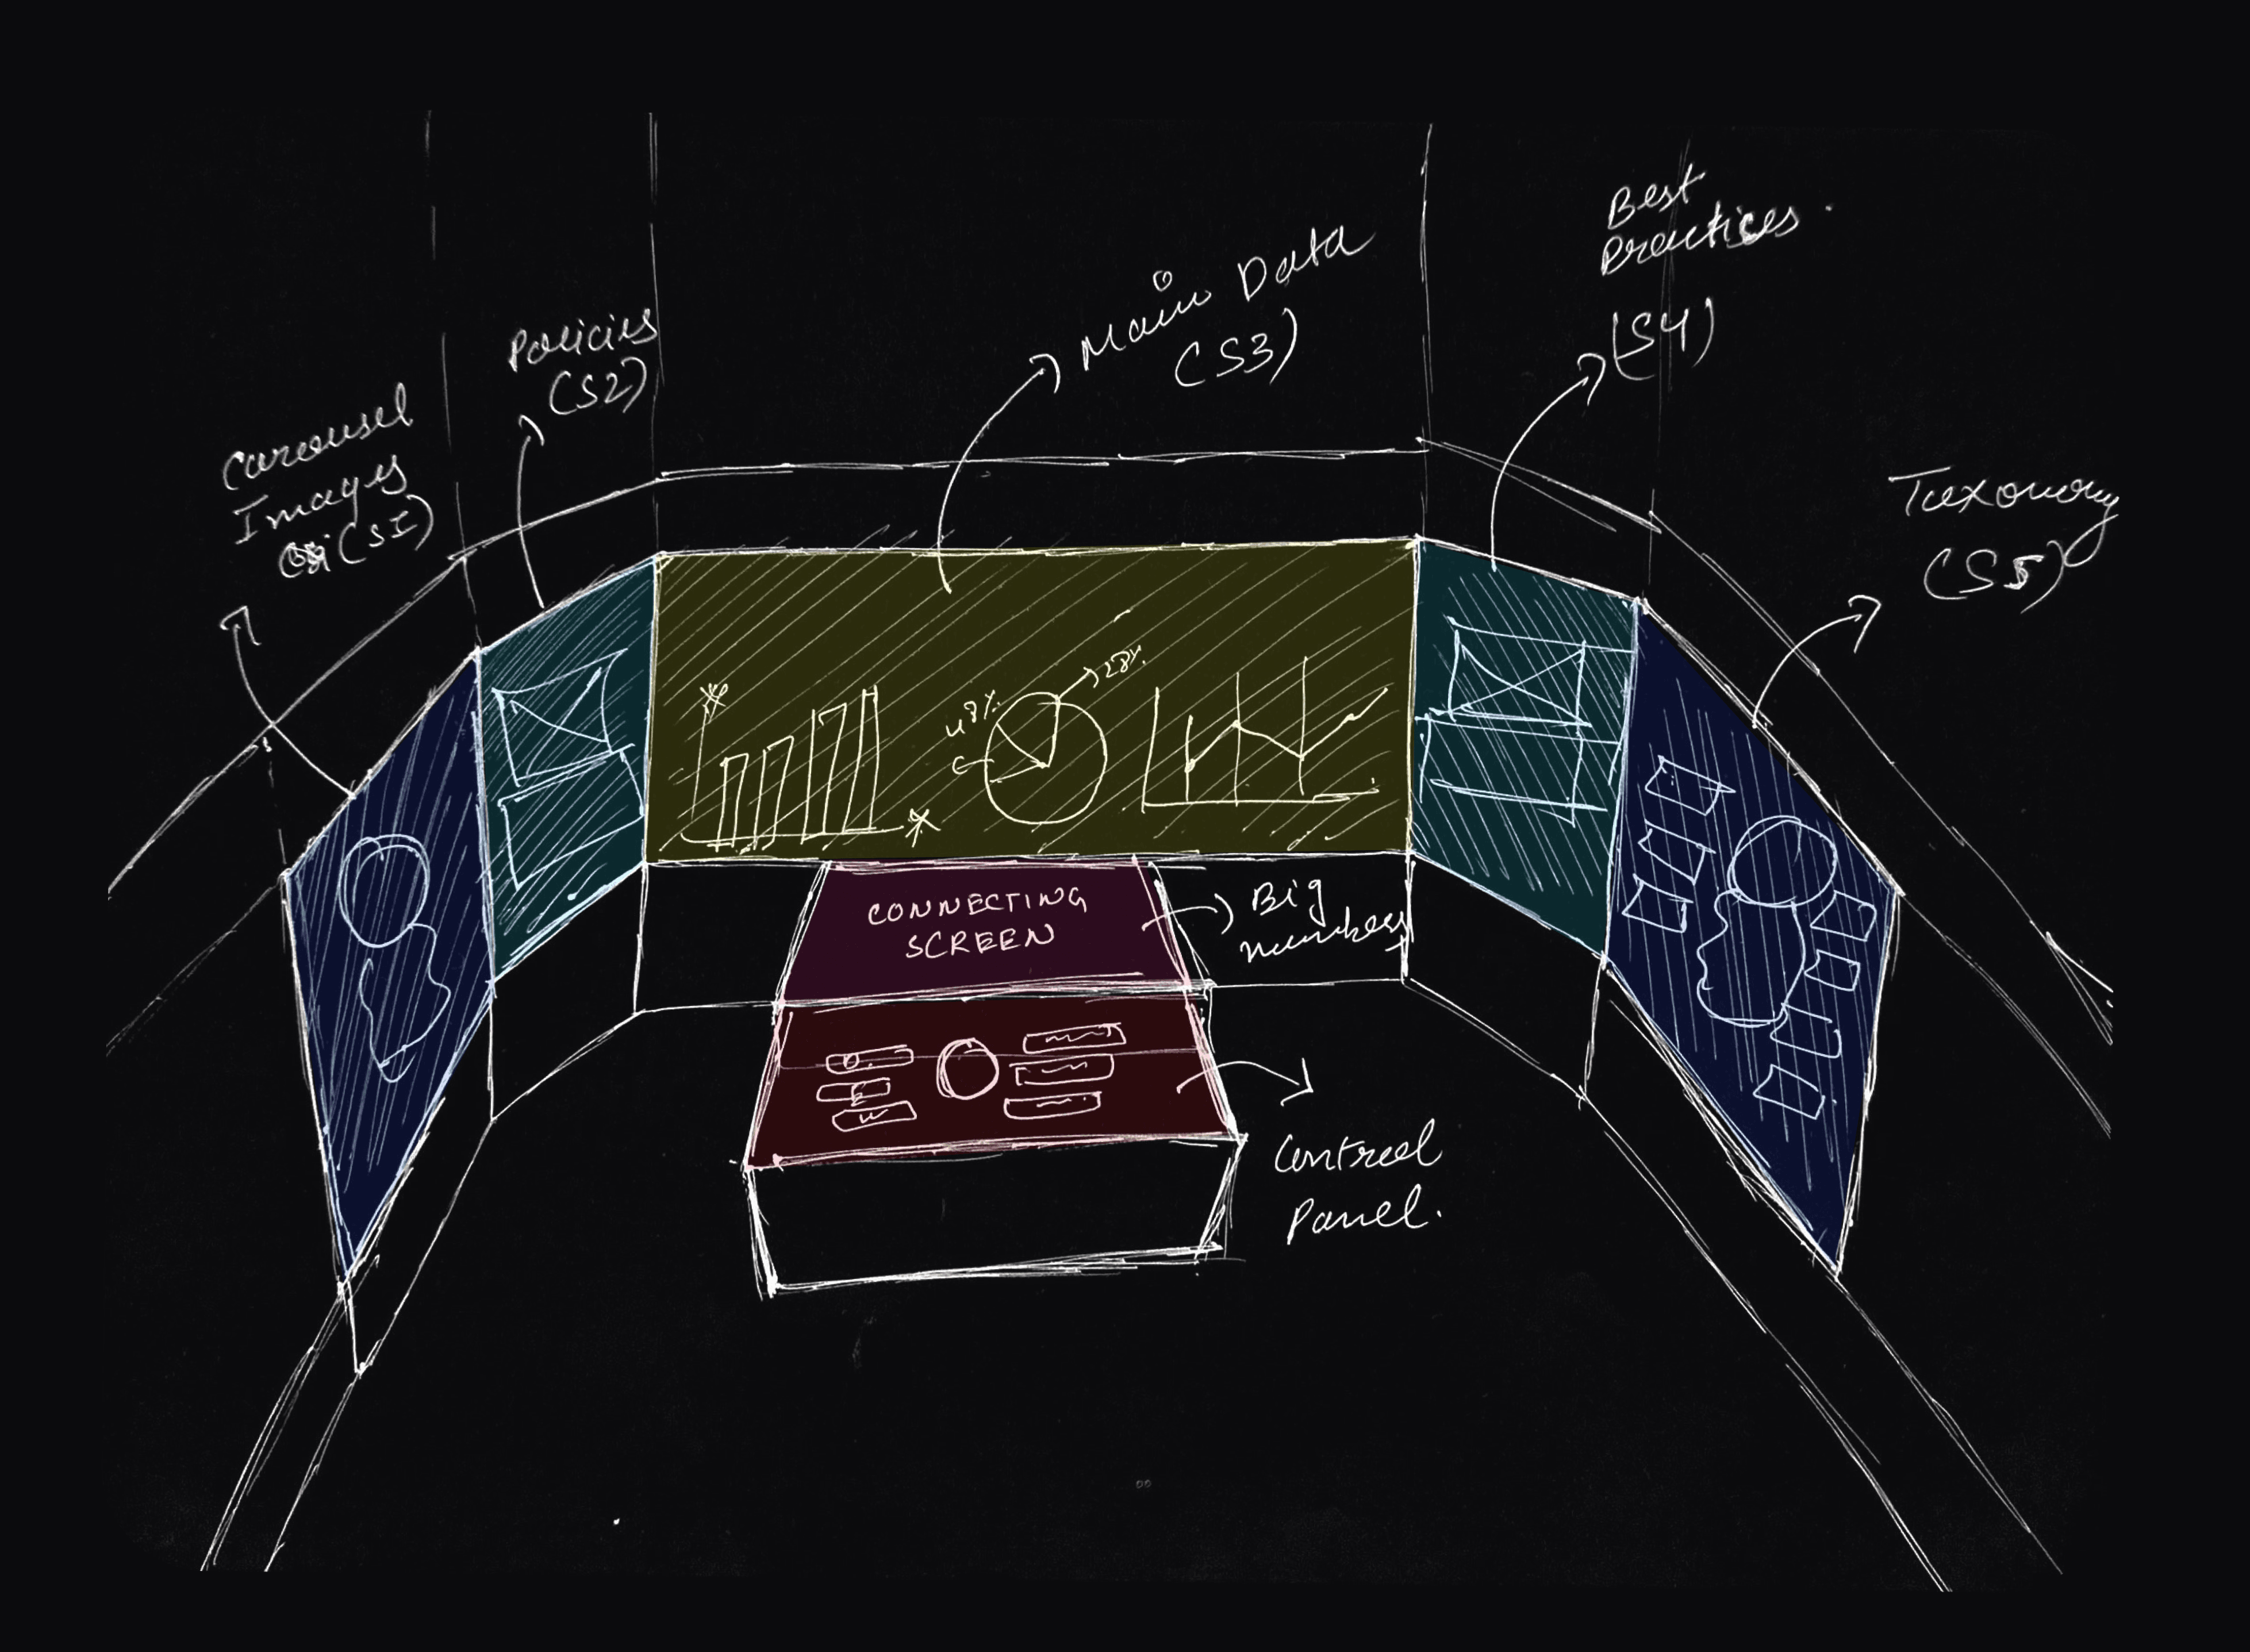
04 — Spatial Experience Planning & Screen Mapping
04 — Spatial Experience Planning & Screen Mapping
04 — Spatial Experience Planning & Screen Mapping
Designing an Immersive Multi-Screen Governance Environment
Once the visualization strategy was finalized, the next phase focused on designing the experience
ecosystem of the NITI Aayog Experience Centre.
Rather than treating the space as a conventional conference room, the environment was conceptualized as a
spatial storytelling experience where governance data could flow seamlessly across multiple immersive screens.
Designing an Immersive Multi-Screen Governance Environment
Once the visualization strategy was finalized, the next phase focused on designing the experience
ecosystem of the NITI Aayog Experience Centre.
Rather than treating the space as a conventional conference room, the environment was conceptualized as a
spatial storytelling experience where governance data could flow seamlessly across multiple immersive screens.
Designing an Immersive Multi-Screen Governance Environment
Once the visualization strategy was finalized, the next phase focused on designing the experience
ecosystem of the NITI Aayog Experience Centre.
Rather than treating the space as a conventional conference room, the environment was conceptualized as a
spatial storytelling experience where governance data could flow seamlessly across multiple immersive screens.
04 — Information Architecture
04 — Information Architecture
04 — Information Architecture
Explore
Explore
Explore
ADP
ADP
ADP
State
State
State
District
District
District
Sector
Sector
Sector
Sub-Sector
Sub-Sector
Sub-Sector
Indicators
Indicators
Indicators
ABP
ABP
ABP
State
State
State
District
District
District
Blocks
Blocks
Blocks
Sector
Sector
Sector
Sub-Sector
Sub-Sector
Sub-Sector
Indicators
Indicators
Indicators
State
State
State
District
District
District
Blocks
Blocks
Blocks
Sector
Sector
Sector
Sub-Sector
Sub-Sector
Sub-Sector
Indicators
Indicators
Indicators
Sectors
Sectors
Sectors
Sector
Sector
Sector
Sub-Sector
Sub-Sector
Sub-Sector
Indicators
Indicators
Indicators
State
State
State
District
District
District
Blocks
Blocks
Blocks
People
People
People
Nari
Nari
Nari
Sector
Sector
Sector
Sub-Sector
Sub-Sector
Sub-Sector
Indicators
Indicators
Indicators
State
State
State
District
District
District
Blocks
Blocks
Blocks
Garib
Garib
Garib
Youth
Youth
Youth
Industry
Industry
Industry
Annadata
Annadata
Annadata
© Vikas Sen 2026
Designed in framer
Every Big Idea Deserves the Right Design
© Vikas Sen 2026
Designed in framer
Every Big Idea Deserves the Right Design
Vikas Sen Portfolio
About NITI Aayog
Established in 2015 as the Government of India’s premier policy think tank replacing the Planning Commission with a more collaborative, technology driven, and data-oriented framework for governance.
Focus Areas
01
Governance & Reforms
02
Data Management & Analytics
03
Sustainable Development Goals
04
Education & Health
05
Agriculture & Rural Development
06
Infrastructure & Connectivity
07
Innovation & Entrepreneurship
08
Monitoring & Evaluation
© Vikas Sen 2026
Designed in framer
Every Big Idea Deserves the Right Design
Scroll to explore
Vikas Sen Portfolio
Vikas Sen Portfolio
Role:
Ui/Ux Designer
(with strong UX ownership)
Year:
2024-2025
Project Type:
Government
Experience Centre
Industry:
Public Policy, Governance, Data Intelligence
Project Collaboration:
National E-Governance Division (NeGD)
Scroll to explore
Role:
Ui/Ux Designer
(with strong UX ownership)
Year:
2024-2025
Project Type:
Government
Experience Centre
Industry:
Public Policy, Governance, Data Intelligence
Project Collaboration:
National E-Governance Division (NeGD)
Scroll to explore
Role:
Ui/Ux Designer
(with strong UX ownership)
Year:
2024-2025
Project Type:
Government
Experience Centre
Industry:
Public Policy, Governance, Data Intelligence
Project Collaboration:
National E-Governance Division (NeGD)